Mapping Toward My Next Culture
When I map, I start by drawing what I already know. Then I look at what I drew. Often the looking teaches me more than the drawing. I notice shape, positioning, color, length, and size. I also note what was “easy” to draw and what felt “hard” or “complicated” to convey. Then I revise the map, and the next version might adjust my question of focus.
I recently mapped my career five times. My intent was to determine the next step, or as I told a colleague yesterday, determine what the next “iteration” of my professional focus might be. My maps moved from a timeline of steps, to the ways I practiced in each step, to the relationships inside each step, to a single line that crossed every mode of practice and ended in an open box. I left the box unnamed as the unknown iteration. A fifth map placed the same steps in calendar years. Then, looking across maps, I began to wonder how the way I draw my past will shape what I imagine doing next.
Drawing What I Know
My first map listed my roles and training in order, twenty-four steps from my undergraduate degree to my data science training. A timeline emphasized sequence. Each step read as its own entry, and the colors beside it showed how I practiced there.
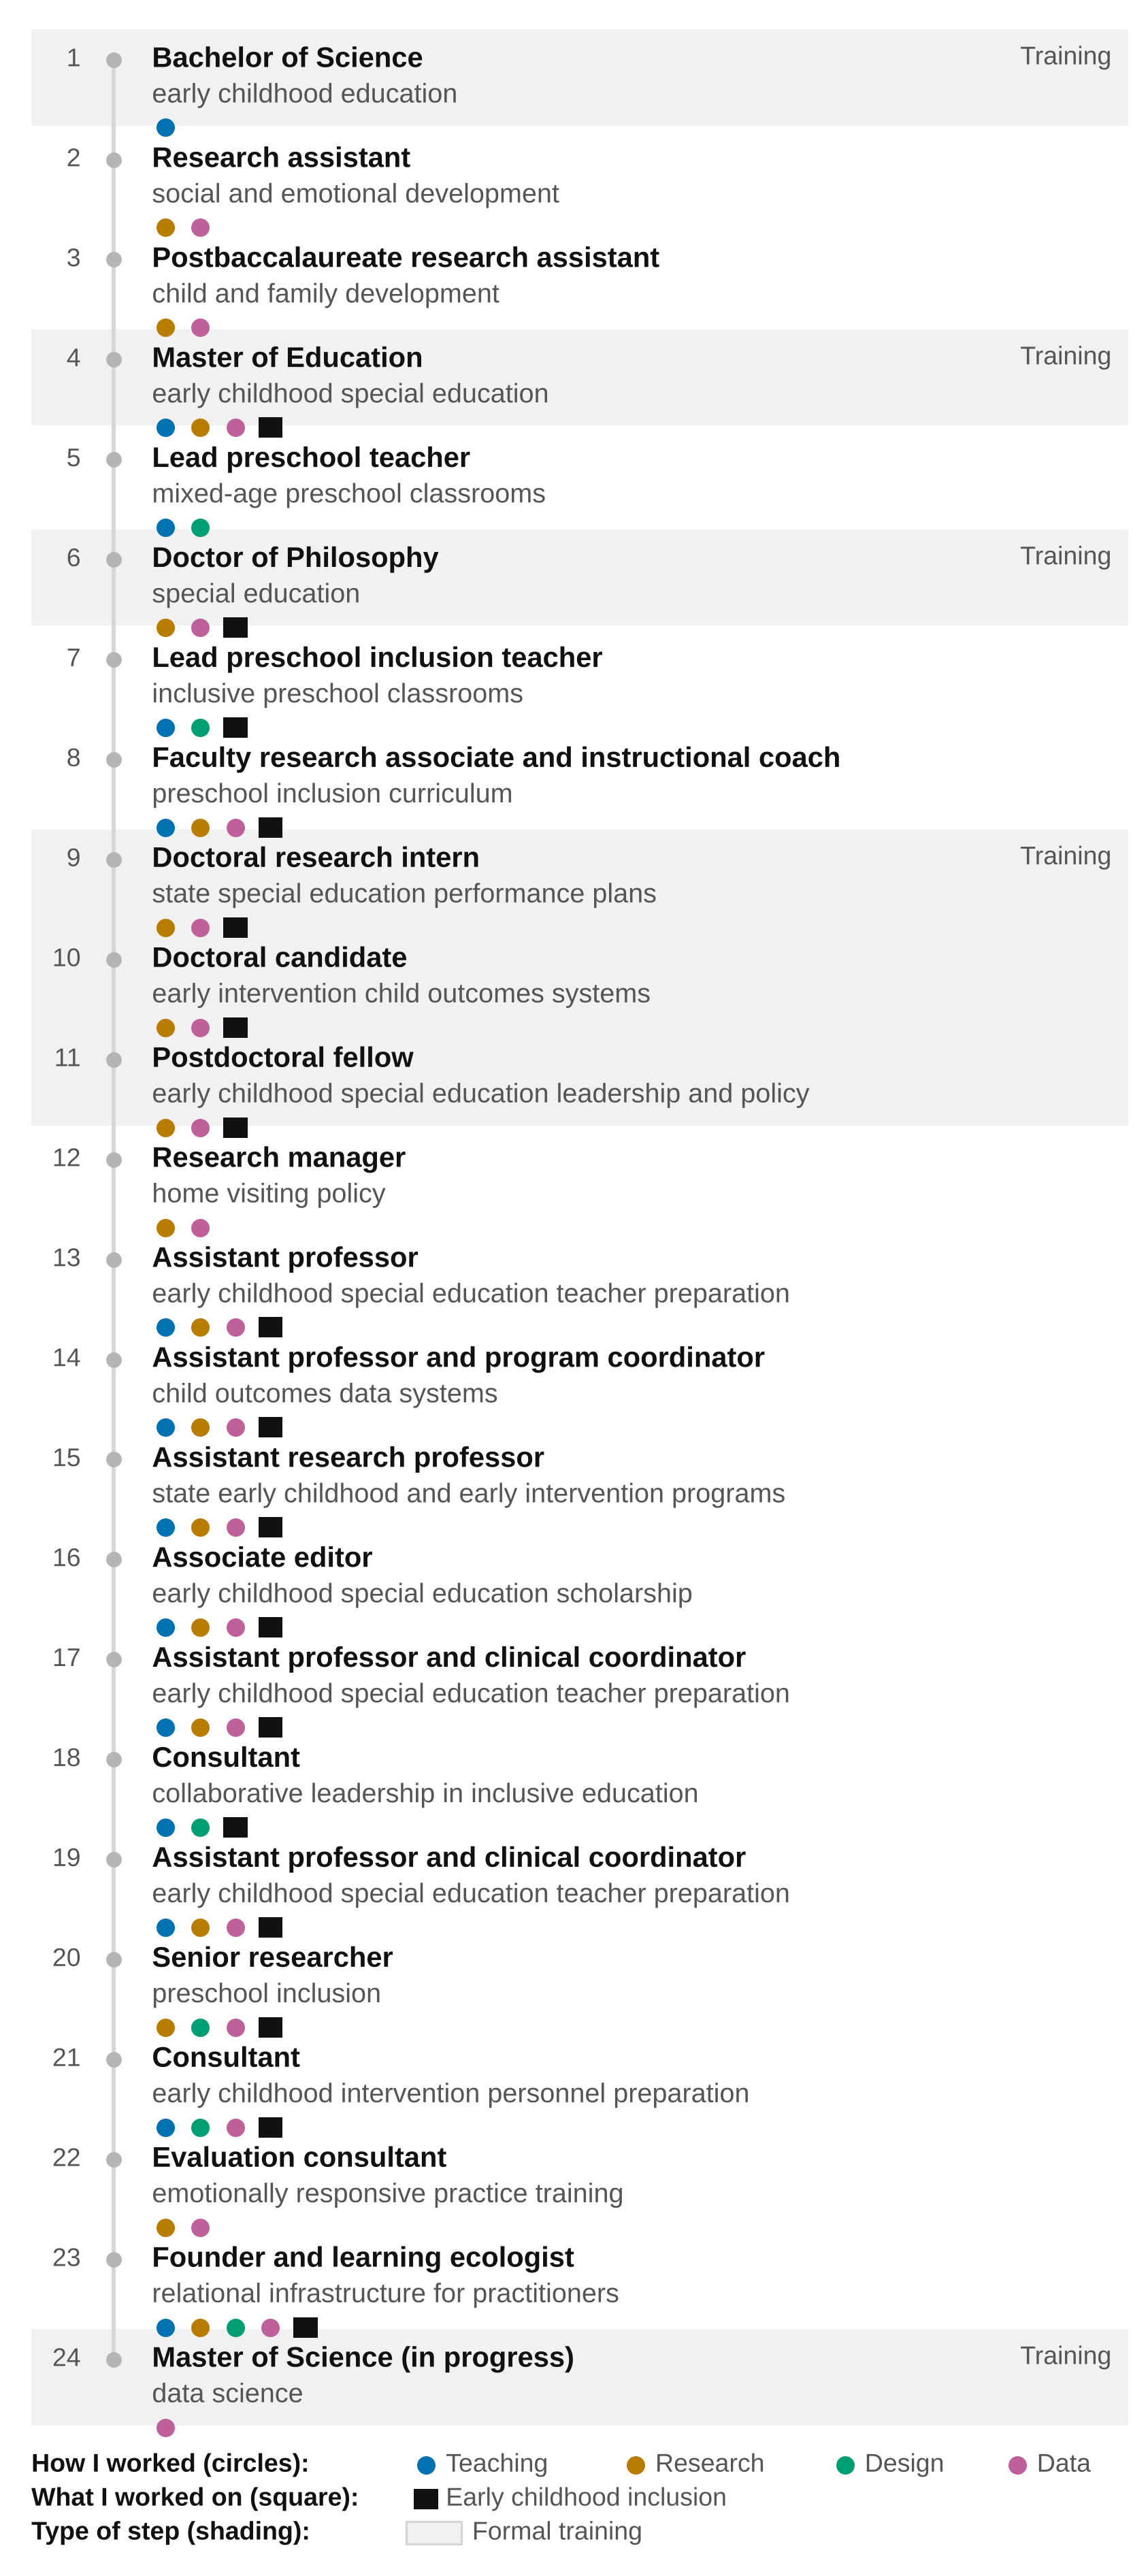
Map 1. Twenty-four steps in order, each with its title and focus. Each kind of information has one form across all five maps: colored circles for how I worked, a black square for what I worked on, shading for formal training, and dark gray for the layer each map adds. The numbers match the columns in Maps 2 to 4.
Map 1. Twenty-four steps in order, each with its title and focus. Each kind of information has one form across all five maps: colored circles for how I worked, a black square for what I worked on, shading for formal training, and dark gray for the layer each map adds. The numbers match the columns in Maps 2 to 4.
In the second map, I separated two things I had placed side by side in Map 1: what I worked on and how I worked. Early childhood inclusion is the content that runs through my career. Teaching, research, design, and data are the modes of practice I applied to it. Seventeen of the twenty-four steps focused on inclusion, and twenty-two involved more than one mode. Inclusion stayed steady while the modes accumulated, and my current work as a learning ecologist involves all four. Data has been part of every step that involved research, and my data science coursework is teaching me new ways to work with it.
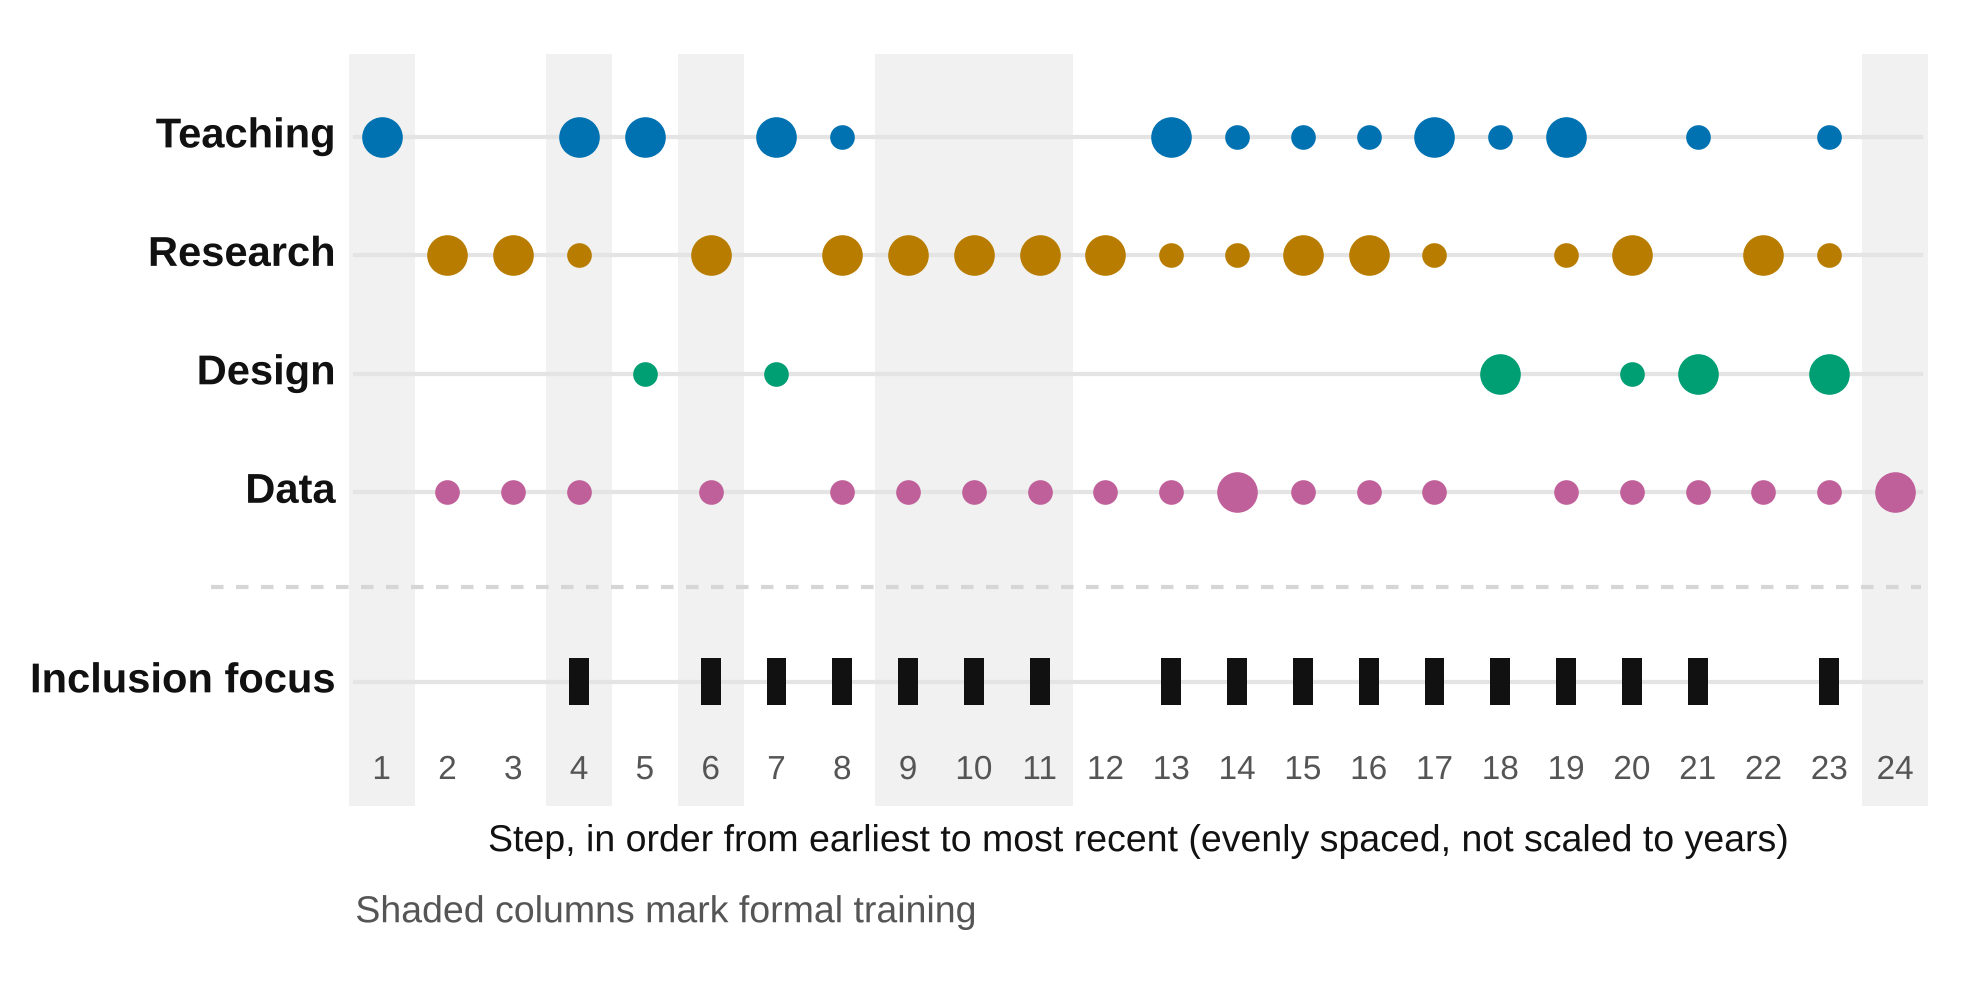
Map 2. The modes of practice each step involved, with a separate row for steps focused on inclusion. Each column is one step, and the larger circle marks its primary mode. The columns follow the order of the steps, since many of them overlapped in time (see Map 5). The columns follow the order of the steps, since many of them overlapped in time. Reading down a column shows how many modes a step drew together.
Map 2. The modes of practice each step involved, with a separate row for steps focused on inclusion. Each column is one step, and the larger circle marks its primary mode. The columns follow the order of the steps, since many of them overlapped in time (see Map 5). The columns follow the order of the steps, since many of them overlapped in time. Reading down a column shows how many modes a step drew together.
In Map 3, I embedded a point of light and a node at every step. A point of light is a relationship that moved me forward. A node is a relationship that slowed my movement and gave me time to examine where I stood (Gupta, 2026b).
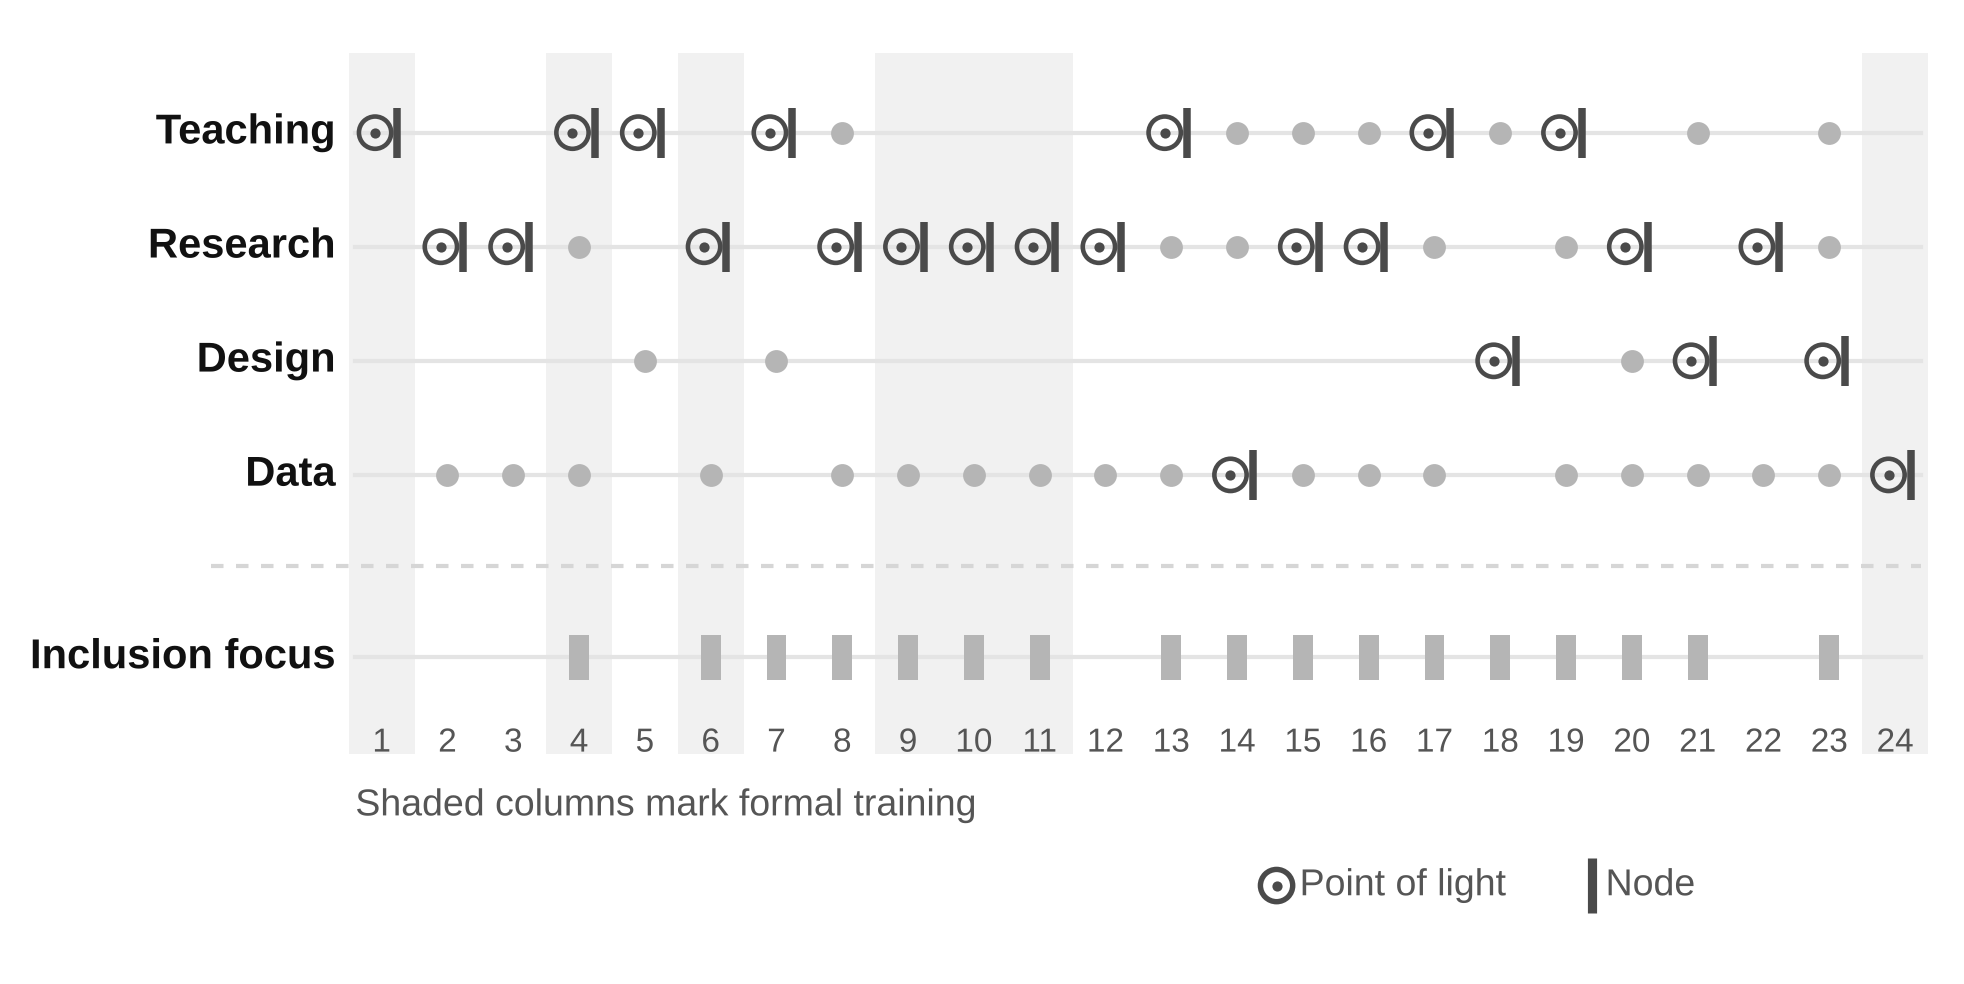
Map 3. Every step has a point of light, drawn as a ring with a dot, and a node, drawn as a short bar, placed in the step’s primary mode. Earlier layers turn light gray.
Map 3. Every step has a point of light, drawn as a ring with a dot, and a node, drawn as a short bar, placed in the step’s primary mode. Earlier layers turn light gray.
In the fourth map, I connected the primary mode of each step. The line moved between modes sixteen times. Maps 2 and 4 show two different patterns. Map 4 shows how I moved from one mode to another as my roles changed. Map 2 shows that my roles combined more modes over time. Across all of that movement, the same questions stayed with me: how a setting makes room for every child and family, what conditions make practice possible, who shapes a space, and what patterns appear across many maps at once.
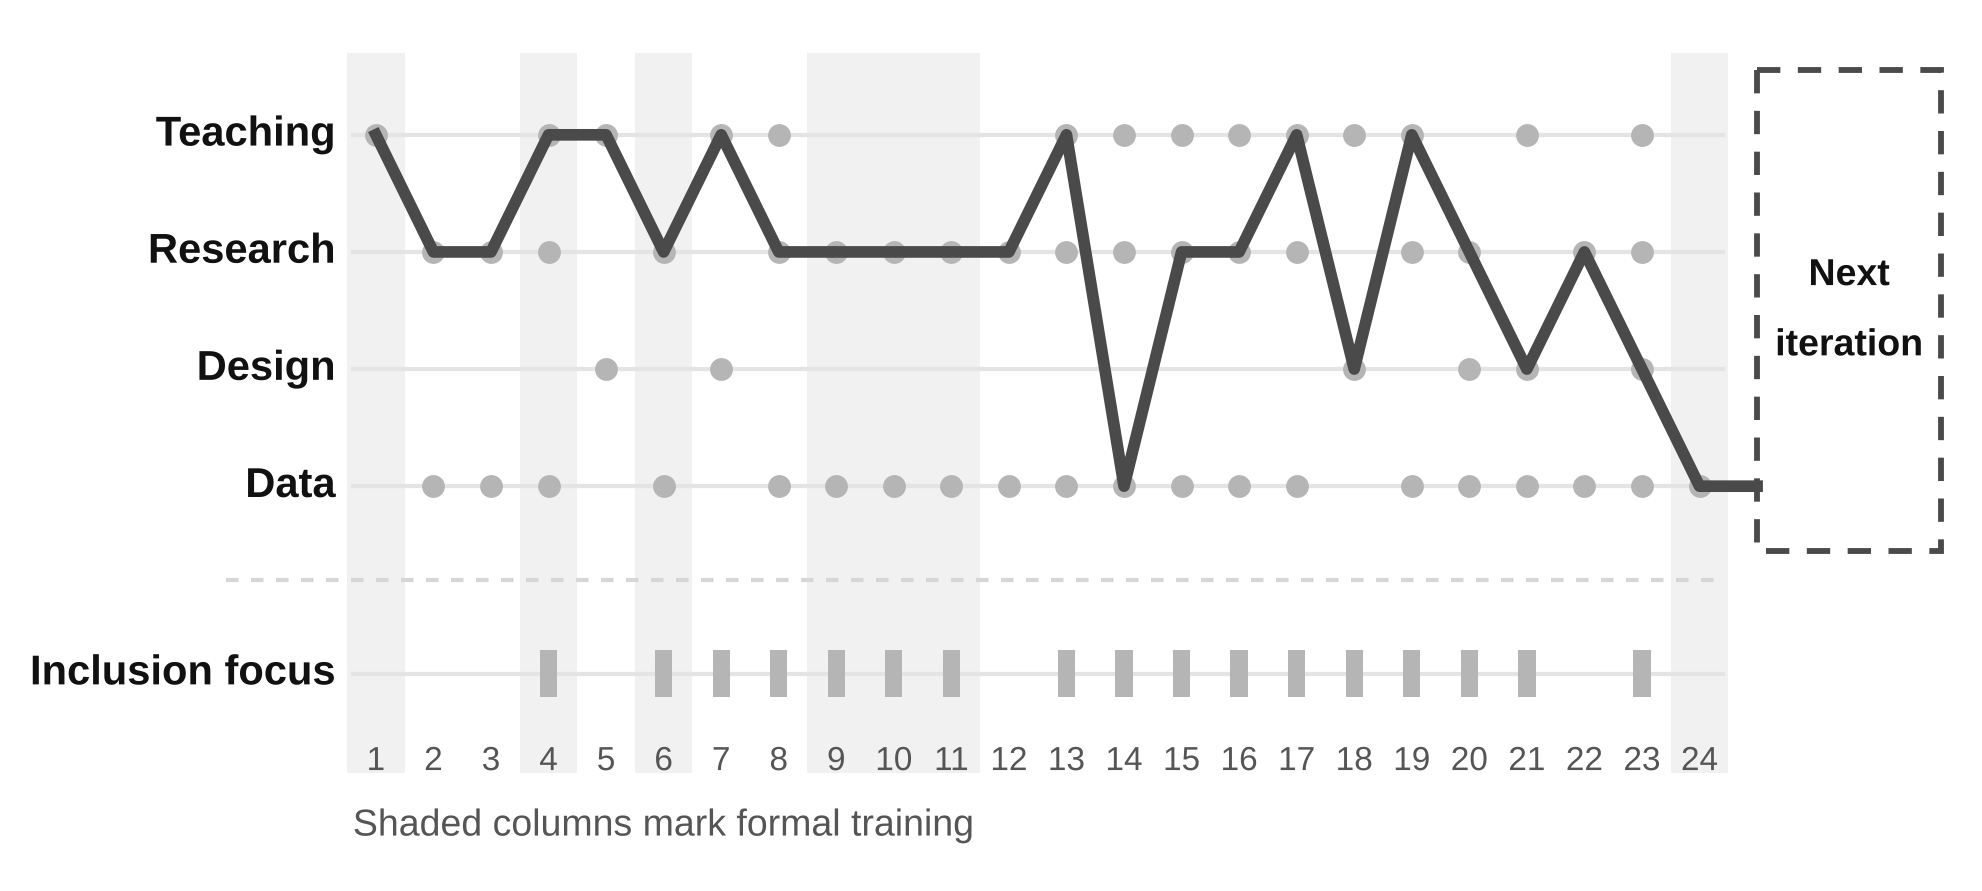
Map 4. A line connects the primary mode of each step in order, showing movement between modes. Earlier layers turn light gray so the line stands out, and the line ends in an open box for the unknown iteration.
Map 4. A line connects the primary mode of each step in order, showing movement between modes. Earlier layers turn light gray so the line stands out, and the line ends in an open box for the unknown iteration.
In the fifth map, I placed each step in calendar years. Many steps overlapped in time. In 2003, 2018, and 2025, four steps were underway at once, and other years included a single step. The years also showed how long each commitment lasted, from one-year roles to a seven-year doctorate.
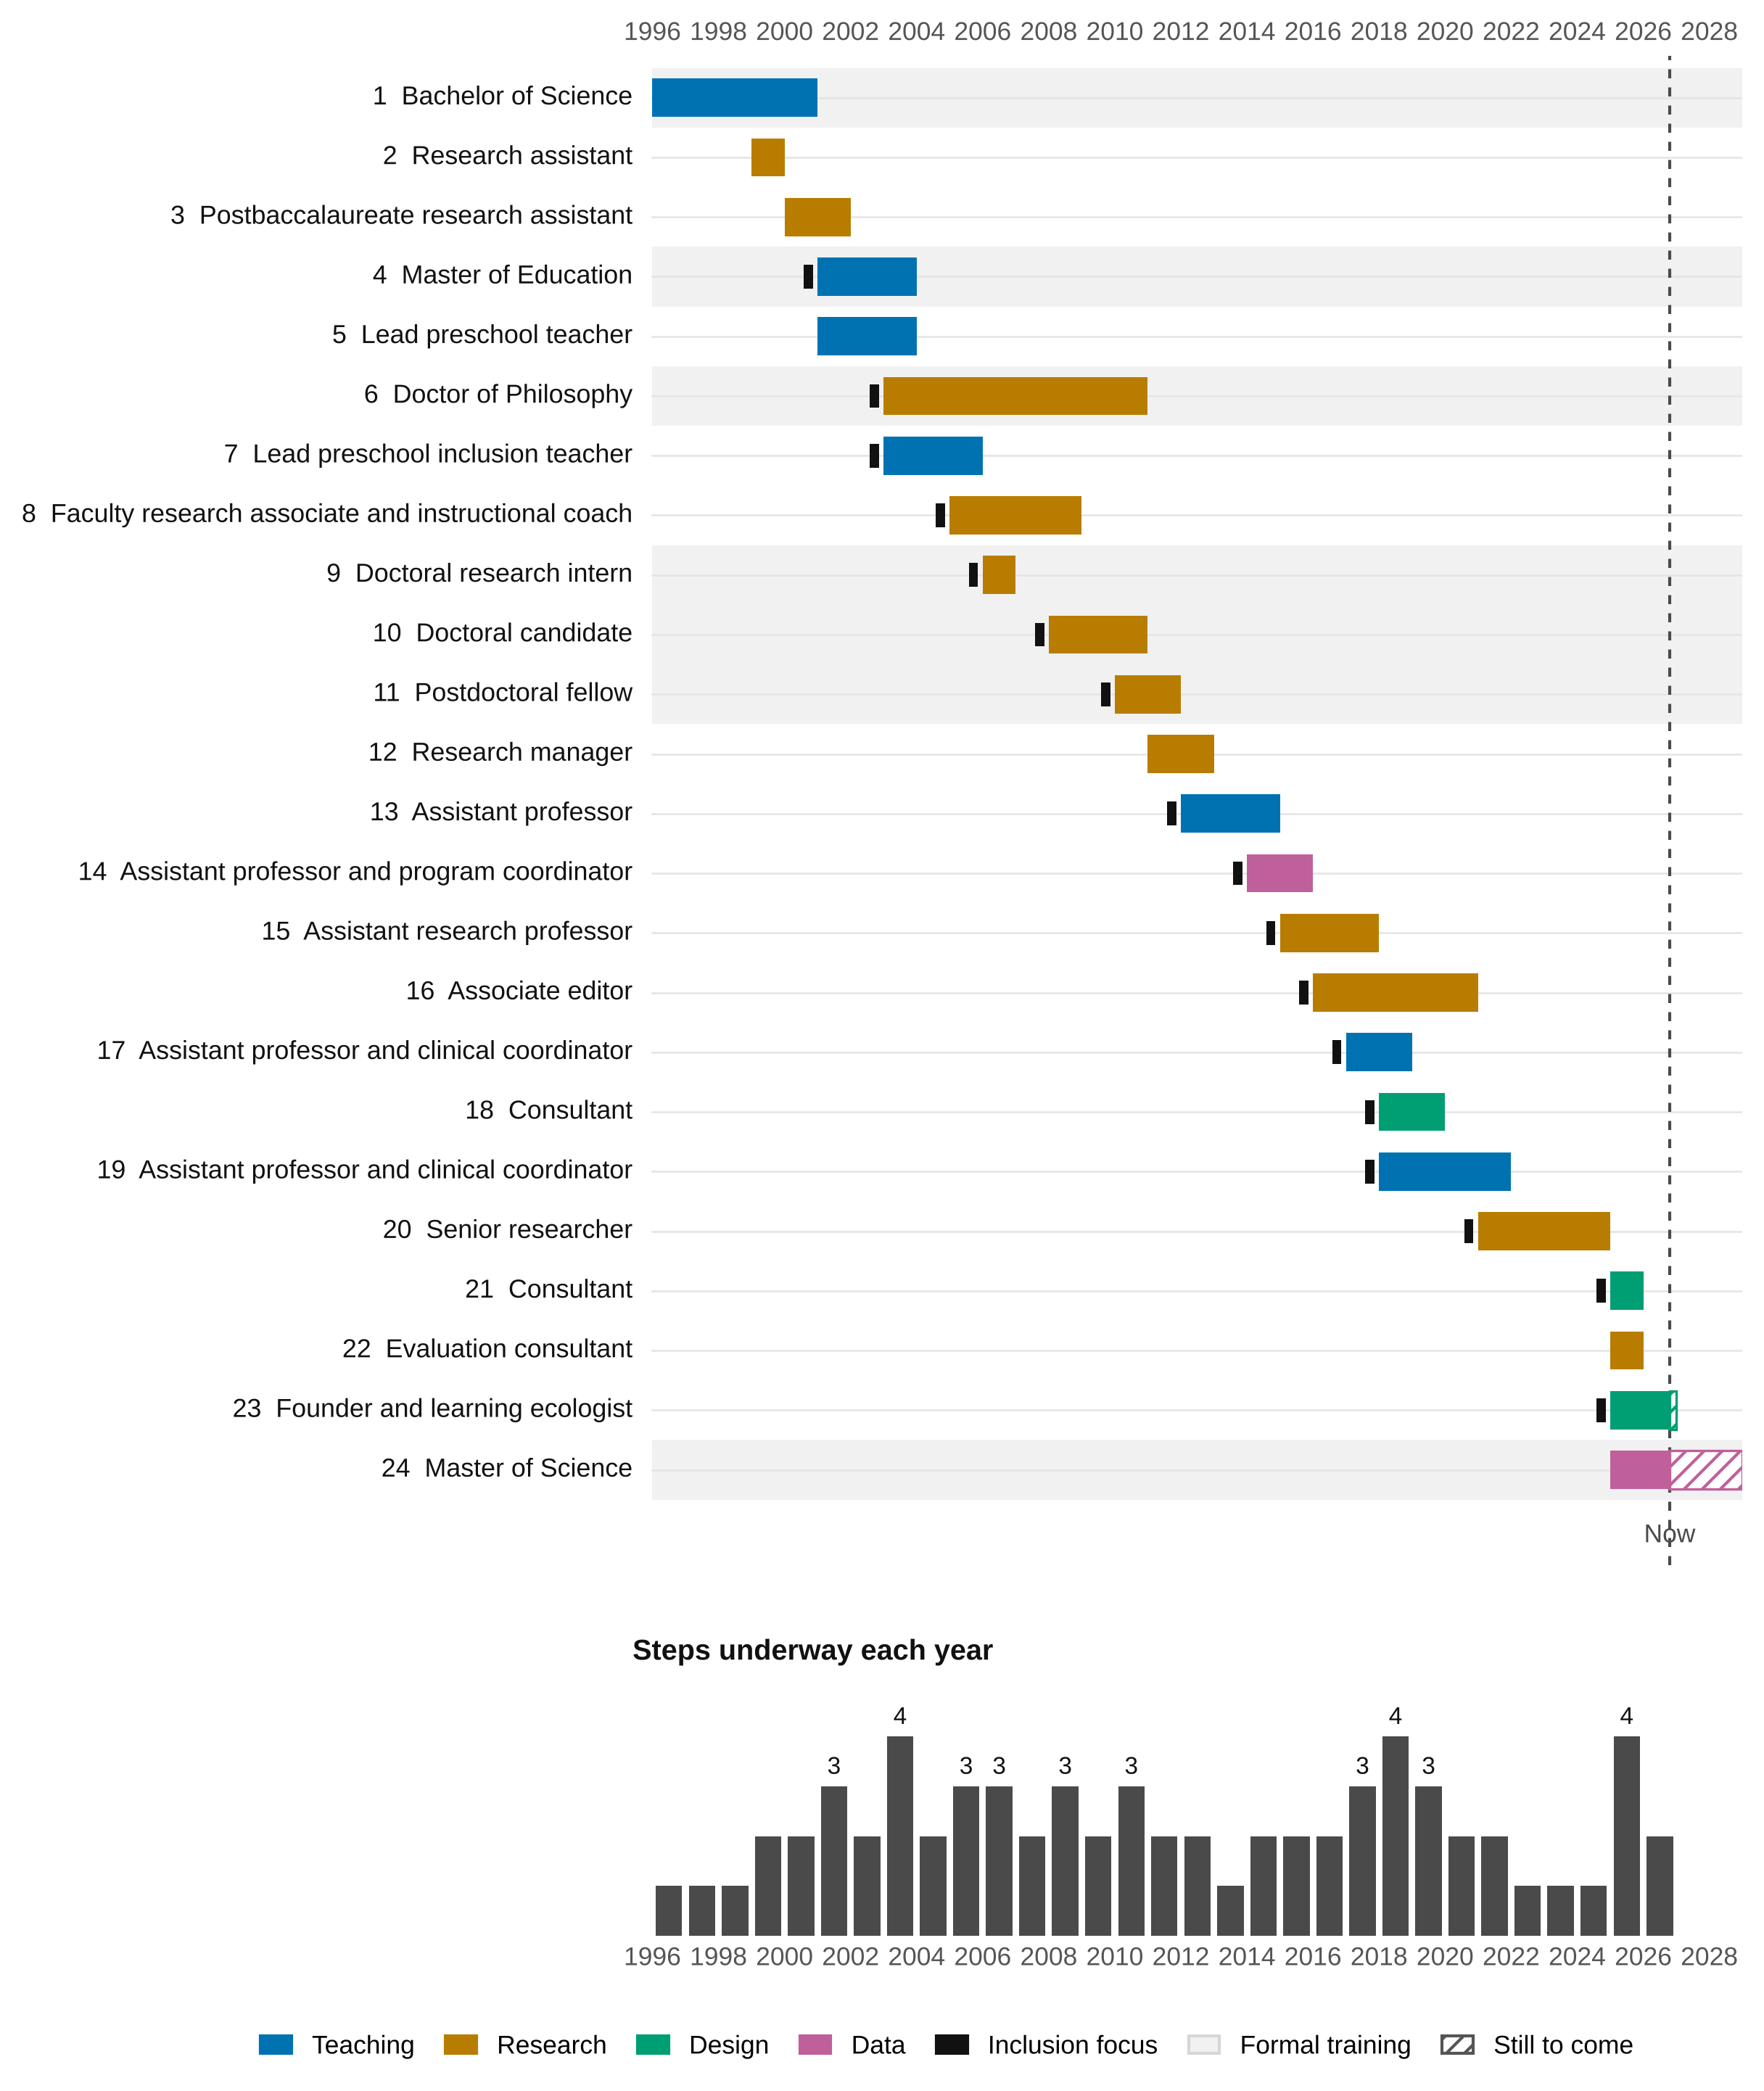
Map 5. Each step placed in calendar years, from start to end. Bar color shows the primary mode, a black square marks an inclusion focus, shading marks formal training, and hatching marks time still to come. The lower panel counts the steps underway each year.
Map 5. Each step placed in calendar years, from start to end. Bar color shows the primary mode, a black square marks an inclusion focus, shading marks formal training, and hatching marks time still to come. The lower panel counts the steps underway each year.
Seeing How the Map Shapes the Question
Each map made some relationships easier to see than others. The timeline showed order. The modes showed how much each step drew together. The relationships showed where something opened or slowed. The line showed movement, and the columns showed integration. The years showed overlap and duration. The twenty-four steps stayed the same across all five maps, and my reading of them changed with each design.
My data visualization course this semester is teaching me to make these design choices on purpose (Hagstrom, 2026). I am learning to set related maps on shared axes so they can be compared, and to use color to group, to distinguish, and to let one element draw the eye (Stone, 2006). In the fourth map, I turned earlier layers light gray and drew the line heavier and darker. That choice directed my own attention to the path.
As my mapping practice extends, I am learning how to choose categories and symbols. Life mapping, as we documented it with early childhood teachers, invites people to map the people, places, materials, obstacles, and opportunities that shaped their education, using colors, symbols, and labels (Gupta & Zhu, 2026a). When I life mapped my own faculty experience, that open prompt got my path down on paper, and the drawing showed me the tenure track as a jail before I could say it myself (Gupta, 2025).
This time, I mapped with more intention and organization. I chose categories and symbols that turned my path into a story, one that helps me notice patterns and make decisions. Two choices changed what I noticed. Giving inclusion its own row, separate from teaching, research, design, and data, showed me that inclusion stayed steady while the modes accumulated. Marking data at every step that involved research showed me that data has been part of my work since my first research position. Each map offers one interpretation of my career, and I can revise it.
Reading Culture in Each Step
Each step on my map is a microsystem with its own routines, relationships, and ways of knowing. Vélez-Agosto and colleagues (2017) revised Bronfenbrenner's (1977) bioecological model to place culture inside the microsystem, in the activities, routines, and relationships that make up a day. Read this way, a classroom, a research team, a design session, and a data lab each have a culture I can observe in ordinary moments: who speaks first, what counts as evidence, and how people respond when a colleague frames a problem through another discipline. Practitioners read these signals every time they join a new team, often by instinct, and mapping gives that reading a structure.
Situations shape what people can do inside them. Duckworth (2026) argues that effort alone has limits, and that the people and places around us, including mentors, peers, and physical surroundings, shape how well we do. Her focus is what a situation brings out in the individual. My maps raise a related question about relationships: what a setting makes possible for everyone in it, and what each person contributes to it in return.
Relationships are where those cultures become visible to me.
Choosing What to Bring Forward
Conscious positioning means knowing what I think and choosing how to engage from that awareness (Gupta, 2026a). The maps give that positioning something concrete to work with: a commitment to inclusion that stayed constant, modes of practice that accumulated, and a set of questions that stayed with me across twenty-four steps. My choice of a next culture includes a choice about where to bring them and what to do with them there.
I am turning situational mapping forward in two ways. Situational mapping traces the people, policies, and conversations that shape collaborative work (Gupta & Zhu, 2026b). First, I use it to read a setting. Who works together here? Which disciplines share the table? Then I use it to plan my part. Which question would I bring into this setting? Which connections could I start across its boundaries? What might people see when teaching, research, design, and data meet around questions of inclusion?
Mapping the Next Step
My fourth map ends in an open box. The second map suggests what I am looking for: a culture where teaching, research, design, and data meet around questions of inclusion as part of daily practice.
A culture shapes practice through its routines. Murakami (2008) describes building a writing life through daily routines, with running as one of them. Duckworth (2026) encourages people to find or build the situations that bring out their best. My part is deciding which questions, relationships, and ways of seeing I bring into the routines of the next setting, and what I help build there for others.
The line on my fourth map stops at the edge of the box. Which of the questions that traveled across my twenty-four steps will I bring through that box, and what will I do with them on the other side?
References
Bronfenbrenner, U. (1977). Toward an experimental ecology of human development. American Psychologist, 32, 513–531. https://doi.org/10.1037/0003-066X.32.7.513
Duckworth, A. (2026). Situated: Find the people and places that bring out your best. Scribner.
Gupta, S. S. (2025, November 5). Life mapping my faculty experience. Ecological Learning Partners. https://ecologicallearningpartners.com/blog/life-mapping-my-faculty-experience
Gupta, S. S. (2026a, January 9). Finding ground: From reactive accommodation to conscious positioning. Ecological Learning Partners. https://ecologicallearningpartners.com/blog/finding-ground-from-reactive-accommodation-to-conscious-positioning
Gupta, S. S. (2026b, July 30). Points of light and nodes: Mapping an ecology of becoming. Ecological Learning Partners. https://ecologicallearningpartners.com/blog/points-of-light-and-nodes-mapping-an-ecology-of-becoming
Gupta, S. S., & Zhu, X. (2026a). Life mapping: Redefining bias training. Educational Leadership, 83(8). https://www.ascd.org/el/articles/redefining-bias-training
Gupta, S. S., & Zhu, X. (2026b). Using situational mapping to explore collaborative dynamics in research-practice partnerships. NNERPP Extra, 8(1), 12–20. https://nnerppextra.rice.edu/resources/how-might-situational-mapping-be-used-in-rpps/
Hagstrom, G. I. (2026). DATA 608: Data visualization [Graduate course]. School of Professional Studies, City University of New York.
Murakami, H. (2008). What I talk about when I talk about running (P. Gabriel, Trans.). Alfred A. Knopf.
Stone, M. (2006). Choosing colors for data visualization. Business Intelligence Network. https://www.perceptualedge.com/articles/b-eye/choosing_colors.pdf
Vélez-Agosto, N. M., Soto-Crespo, J. G., Vizcarrondo-Oppenheimer, M., Vega-Molina, S., & García Coll, C. (2017). Bronfenbrenner's bioecological theory revision: Moving culture from the macro into the micro. Perspectives on Psychological Science, 12(5), 900–910. https://doi.org/10.1177/1745691617704397
Sarika S. Gupta, Ph.D., M.Ed. is the founder of Ecological Learning Partners LLC. She is an applied researcher and learning ecologist whose work focuses on early childhood inclusion. She brings teaching, research, design, and data to mapping methodologies that help practitioners and programs see the conditions shaping their work. She is completing an M.S. in Data Science.