My work centers on reflective inquiry. Reflective inquiry is a disciplined way of making meaning that links one experience to the next and to other ideas, and it grows through work with others (Rodgers, 2002). I facilitate self-to-system reflective inquiry and mapping, so practitioners study their own experience and connect it to the programs and systems around them.
In my last post, I mapped my career as I considered my next role (Gupta, 2026). I don’t know yet what that role will be, but I do know I want to continue bringing people together to reflect individually and collectively. The interviews I conducted with state Part C early intervention coordinators and state Part B-619 preschool special education coordinators for my dissertation had the unintended effect of helping participants reflect on their work, as one coordinator told me in our debrief. Since my work at Johns Hopkins University (JHU), I have intentionally convened professionals and families to reflect on their work and co-develop strategies and solutions that strengthen educational systems. This post shares one way to begin that work: each person maps their own record, and the group then looks across records for shared aims.
As I consider my next role, I decided to apply what I am learning in DATA 608: Knowledge and Visual Analytics, a course on data visualization and mapping at the CUNY School of Professional Studies, to my own teaching record. Faculty already reflect on their teaching record when they write a teaching statement. The College of Education and Human Development at George Mason University (GMU), where I taught from 2012-2014, for example, expects tenure candidates to show how they think about their teaching in that statement (George Mason University College of Education and Human Development, 2024).
The record I share here covers the 19 courses I taught as an undergraduate teaching assistant, graduate teaching assistant and faculty member across 33 semesters between 1998 and 2021. For this analysis, I only used course-titles instead of syllabi or teaching materials. Course titles are surface-level information, and I started there on purpose to test this visualization strategy. With a team, I would also start at the surface, with roles, research focus areas, and discipline-specific terms, to find shared interests and begin building a shared language.
In this post, I share the design principles and the design decisions I made as I revised the graphics. I close with a way interdisciplinary teams can pool their interests to find shared aims and generate shared goals.
A gap in early intervention and early childhood special education (EI/ECSE) teacher educator self-study research
Teacher educators have long studied their own practice. In self-study of teacher education practices (S-STEP), teacher educators research their own teaching to improve it and to put into words what they know as professionals (Vanassche & Kelchtermans, 2015). One reason teacher educators begin self-study is to check whether their practice matches their beliefs (Loughran, 2007). Early childhood teacher educators have used self-study to examine a program reform (Han et al., 2020) and online teaching (Green et al., 2013), and special education teacher educators have examined how they supervise student teachers (Bussey & Lay, 2023).
In early intervention and early childhood special education (EI/ECSE) preparation, research on reflection has centered on candidates. One blended program, for example, tied its reflection assignments to professional standards and used nine years of candidate reflections to improve the program (Purcell & Schmitt, 2023). Mapping course content onto professional standards, such as the Division for Early Childhood (DEC) Recommended Practices, asks a different question: whether courses cover what the field expects (Division for Early Childhood, 2014). My own earlier work examined reflection within single courses in EI/ECSE/ECE teacher preparation programs (Gupta, 2021; Gupta & Lewin-Smith, 2020).
In my search, I found few studies of EI/ECSE teacher educators examining their own practice, and none that mapped a teaching record across a career. This visualization strategy offers one way for teacher educators to map a teaching record; it could also be a tool interdisciplinary teams can use to pool interests toward identifying shared aims.
The design principles
I applied six principles from my data visualization course.
Position on a common scale. People judge position along a common scale more accurately than other graphical encodings (Cleveland & McGill, 1984). I gave each semester its own mark, placed in order within its setting, so the map shows counts instead of sizes.
Redundant coding. Color alone does not reach every reader, so I showed role with color and named it in each panel header. I also chose a universal color palette (Wilke, 2019).
A distinct cue for each variable. In the record map, rows show theme, color shows role, and shape shows delivery: a filled circle for face-to-face, a diamond for face-to-face and online across semesters, and an open circle for online. In the two code grids, each column is one code and each row is one course.
A title that states the finding. Each graphic has a title that states what it shows and a subtitle that describes the data (Hagstrom, 2026).
Remove what does not serve the data. I removed marks and elements that cluttered or were not helpful in seeing the data, including training lines, highlight bands, a clinical coordinator bracket, and a label about my years outside teaching (Knaflic, 2015; Tufte, 2001).
Small multiples. Repeating the same chart for each group enables a side-by-side comparison (Wilke, 2019). I gave each setting its own panel, with gray space for the years between settings and a thin line for each calendar year.
The design decisions I made
I revised each graphic by checking it against the principles above.
From a table to a timeline. I started with a table of course topics from my CV and moved to a chart with my teaching settings in time order.
A complete record. My CV does not list everything I taught. I added two courses I co-taught as a graduate teaching assistant and a peer coaching seminar I co-taught as an undergraduate teaching assistant.
From bubbles to marks. I replaced sized bubbles with one mark per semester.
Delivery in shape. I found half-filled symbols difficult to differentiate visually, so I gave each delivery mode its own shape.
Codes beyond theme. I coded each course by role, program type, and course type, along with theme.
From a tree to a grid. A tree diagram showed only the order of courses, so I displayed the groups as a grid of each course’s codes.
Row totals. I added the total semesters at the end of each theme row, so the map shows where most of my teaching falls.
How my courses differed by setting
Between 1998 and 2021, I taught at four colleges and universities in three overarching roles. At the University of Maryland (UMD), I co-taught as an undergraduate teaching assistant from 1998 to 1999 and as a graduate teaching assistant from 2004 to 2005, and I taught as a faculty member in 2016. I later taught as a faculty member at GMU from 2012 to 2014, at George Washington University (GWU) from 2017 to 2018, and at Hunter College from 2018 to 2021.
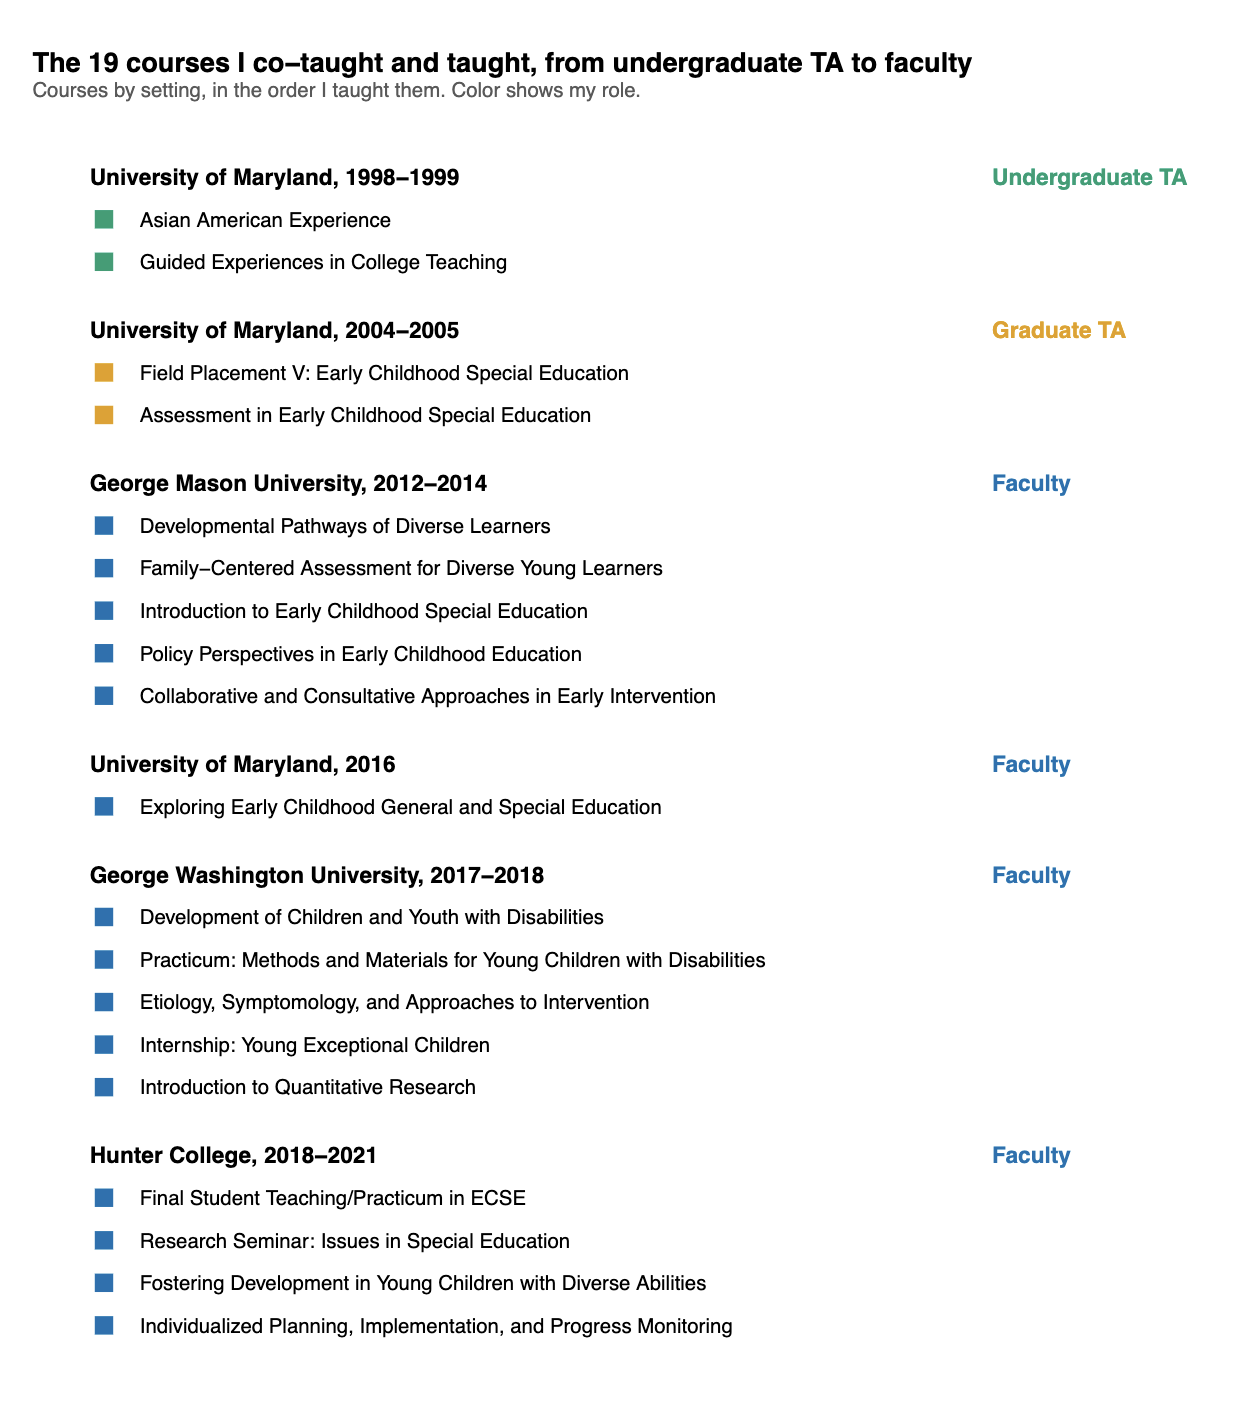
A list of the 19 courses I co-taught and taught, grouped by setting and year. The settings are the University of Maryland (UMD) as an undergraduate teaching assistant (TA) from 1998 to 1999 (2 courses), UMD as a graduate TA from 2004 to 2005 (2), George Mason University (GMU) faculty from 2012 to 2014 (5), UMD faculty in 2016 (1), George Washington University (GWU) faculty from 2017 to 2018 (5), and Hunter College faculty from 2018 to 2021 (4). Colored squares mark my role in each course: green for undergraduate TA, orange for graduate TA, and blue for faculty.
Each institution and role is one setting in the graphics, totaling six in all. At GMU, I taught content courses only. At GWU and Hunter, I taught clinical and research courses along with content courses, and I also coordinated the clinical programs for teacher candidates. I taught development and disability courses at every institution where I taught as faculty. I taught as many semesters in blended ECE/ECSE programs, at GMU and GWU, as in EI/ECSE at Hunter. I taught every course face-to-face through 2012. Beginning in 2013, I also taught online. From 2018 to 2021, I taught each course in both modalities across semesters.
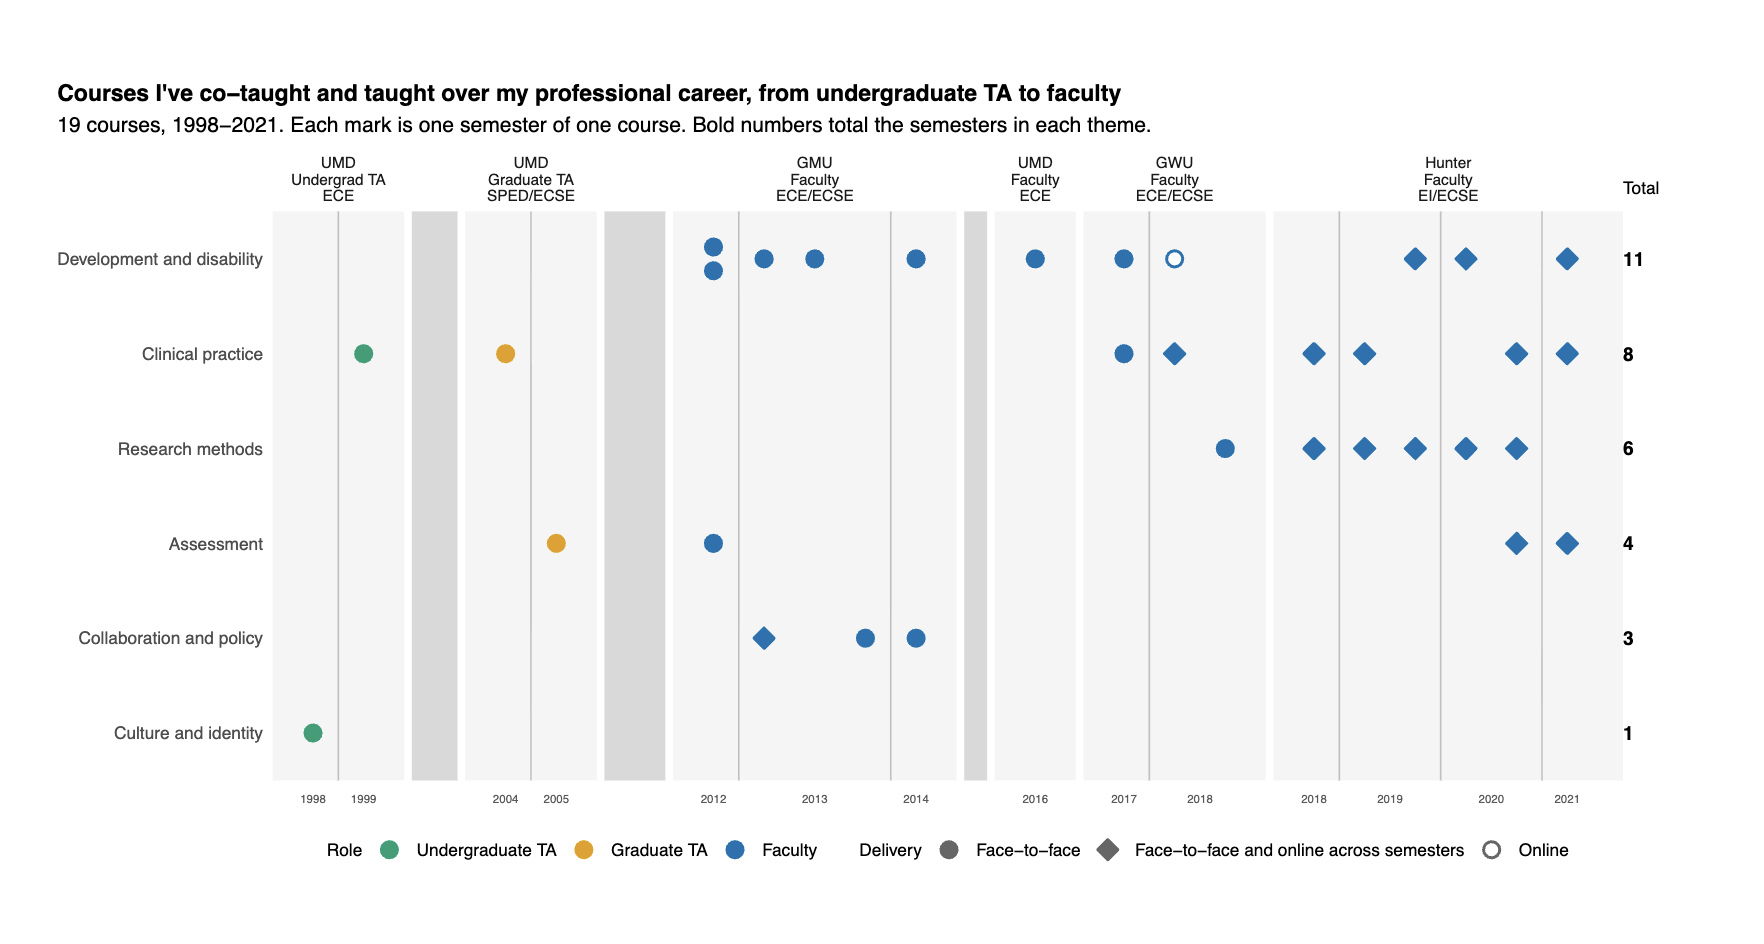
Graphic 2: A timeline of my courses from 1998 to 2021, arranged in six theme rows. The rows and their semester totals are Development and disability (11), Clinical practice (8), Research methods (6), Assessment (4), Collaboration and policy (3), and Culture and identity (1). Each column is a setting, and gray bands show the years between settings. Color shows my role. Shape shows delivery: a filled circle for face-to-face, an open circle for online, and a diamond for face-to-face and online across semesters.
Grouping my courses by type
I coded each of my 19 courses by role, program type, course type (content, clinical, or research), and theme.
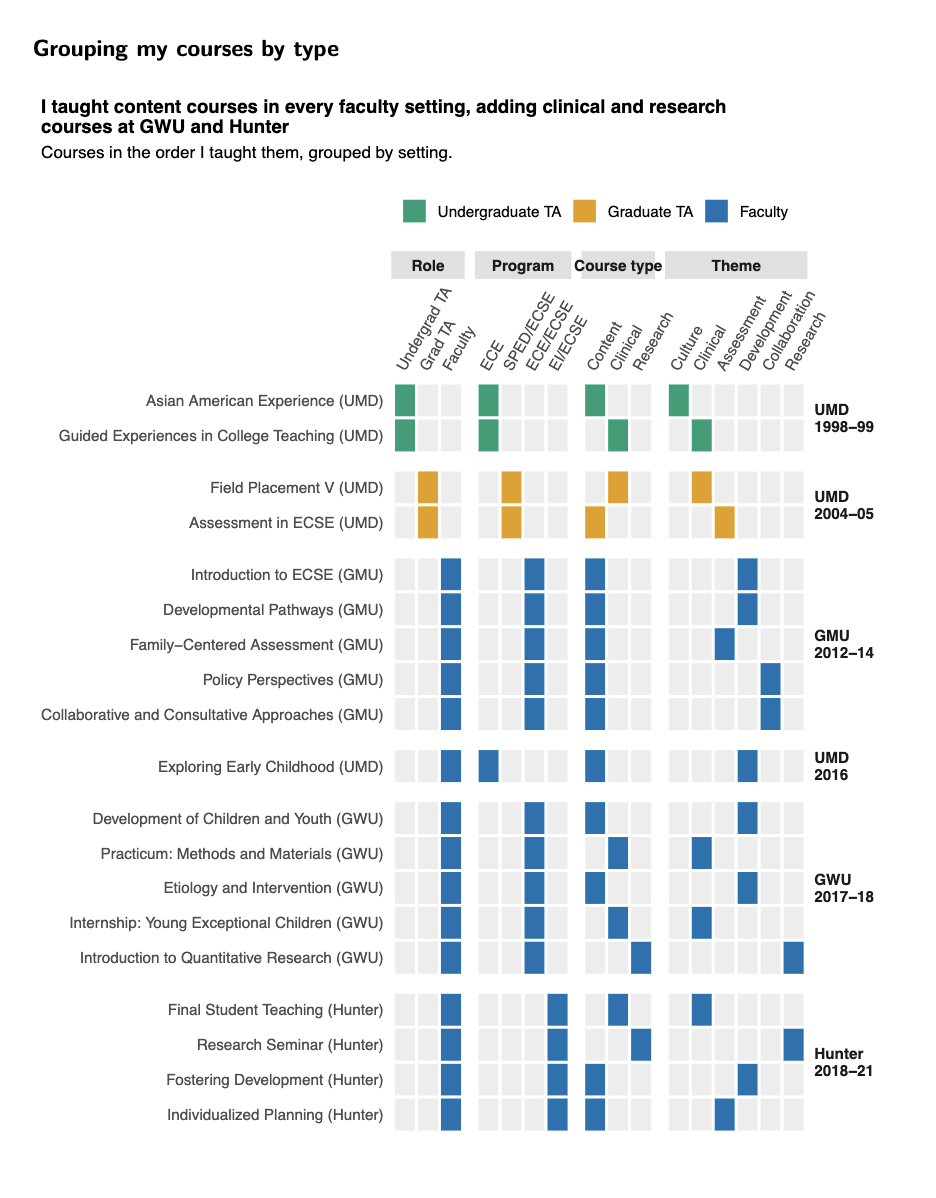
Graphic 3: A grid of my 19 courses in the order I taught them, grouped by setting. The columns are grouped under role, program, course type, and theme, and a filled cell marks each code a course has. Content courses appear in every faculty setting. Clinical and research courses appear only at GWU and Hunter.
When I grouped my courses by the codes they share, my faculty courses sorted into three groups by course type, each spanning more than one institution:
Content: courses at GMU, UMD, GWU, and Hunter
Clinical: Practicum and Internship at GWU, and Final Student Teaching at Hunter
Research: Introduction to Quantitative Research at GWU and the Research Seminar at Hunter
My teaching assistant courses formed two small groups, one for each role.
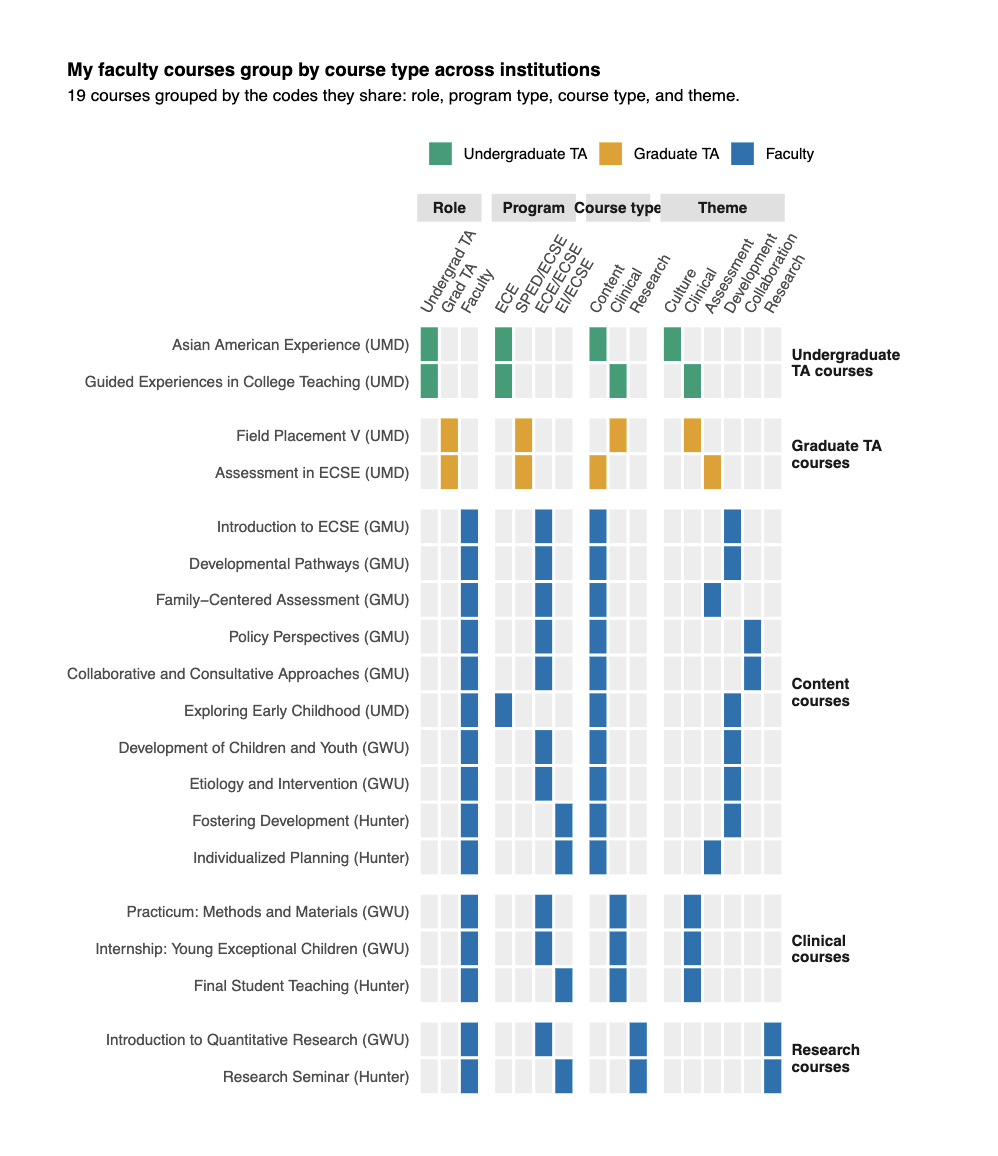
Graphic 4: A grid of my 19 courses with the rows grouped by the codes they share for role, program, course type, and theme. A filled cell marks each code a course has. The courses form five groups: undergraduate TA courses (2), graduate TA courses (2), content courses (10, from GMU, UMD, GWU, and Hunter), clinical courses (3, from GWU and Hunter), and research courses (2, one each from GWU and Hunter). My faculty courses group by course type rather than by institution.
Questions that helped me examine my record
What did I teach at the beginning and the end of my record?
What did I teach in every setting? Was it assigned, or did I choose it?
What changed, and what did I choose to change?
What did my course titles leave out (e.g., the aims, questions, and strategies driving my teaching)?
What shaped my teaching: my prior experience, my current practice, or my research?
Digging deeper into course content
The same steps work with richer materials: gather the record, code it, map it, and examine it with open questions. To code these materials, thematic analysis offers six phases that move from getting to know the data, to coding it, to building and refining themes (Braun & Clarke, 2006).
Course content. I could code syllabi, course descriptions, and readings for the ideas I asked candidates to engage with, then map the themes over time to see which ideas I returned to across settings.
Related conference presentations. I could code the titles and abstracts of my presentations by topic and audience, then map them alongside my courses to see where my teaching and scholarship meet.
Teaching strategies. I could code weekly slides and course materials for the strategies I used, such as think-pair-share, fishbowl discussions, or arranging the physical space of the classroom to facilitate role taking, then map them by course and year to see which strategies I used across courses and which I adapted.
I could dig deeper into these layers with a specific lens. A strengths-based lens (Fenton et al., 2015) could show whether my assignment instructions and rubrics described children, families, and candidates by their strengths, and I could use the same lens with student assignments to show students whether they conveyed a similar lens in their own work. An implementation framework (Meyers et al., 2012) could show how I built practices into my courses over time. An ecological framework (Vélez-Agosto et al., 2017) could show how my courses addressed the cultures and settings around children and families.
Jumpstarting interdisciplinary work
Teacher educators can start this work in the partnerships they already belong to. In research-practice partnerships (RPPs), researchers and practitioners collaborate over time on problems that practitioners face (Coburn & Penuel, 2016). Faculty in these partnerships often work with district and state staff, families, and colleagues from other disciplines who know each other’s titles but not each other’s work. Faculty can take the first step by mapping their own record of interests and inviting their partners to do the same. A record of interests can include courses, focus areas, research areas, funding streams, or disciplines. Together, the group can map the pooled records to find shared aims, the foundation for generating shared goals.
The group co-generates the codes, because agreeing on what a code means is part of the inquiry, and different definitions can reveal different assumptions about the work. Each person chooses what to share. The map belongs to the group, and each record belongs to the person who shared it. The group uses the map to ask questions about each other’s work.
Mapping shared aims together
Before the session:
Each person lists their record of interests: courses, focus areas, research areas, funding streams, or disciplines.
Each person shares their list with the group.
During the session:
The group reads the lists and co-generates the codes.
Each person writes each of their interests on a sticky note, adds its codes, and places it on a shared wall.
The group then arranges the notes so interests that share codes sit together, the way Graphic 4 groups my courses.
Each person finds two interests on the wall: one that sits near their own and one that sits far from it.
Each person meets first with the person whose interest sits near theirs, then with the person whose interest sits far from it, and they talk about the questions below.
The group reconvenes to share what they learned about each other’s work, and names the shared aims they found.
The group keeps that list as the foundation for generating shared goals in a later session.
Questions for each conversation
What did this work ask of the people you served?
What did you learn from it that you still use?
What would you like to know about my work?
References
Braun, V., & Clarke, V. (2006). Using thematic analysis in psychology. Qualitative Research in Psychology, 3(2), 77–101. https://doi.org/10.1191/1478088706qp063oa
Bussey, H., & Lay, C. D. (2023). Reflections on strategies for university supervision in special education. Frontiers in Education, 7, Article 1042645. https://doi.org/10.3389/feduc.2022.1042645
Cleveland, W. S., & McGill, R. (1984). Graphical perception: Theory, experimentation, and application to the development of graphical methods. Journal of the American Statistical Association, 79(387), 531–554. https://doi.org/10.1080/01621459.1984.10478080
Coburn, C. E., & Penuel, W. R. (2016). Research–practice partnerships in education: Outcomes, dynamics, and open questions. Educational Researcher, 45(1), 48–54. https://doi.org/10.3102/0013189X16631750
Division for Early Childhood. (2014). DEC recommended practices in early intervention/early childhood special education 2014. https://www.dec-sped.org/recommendedpractices
Fenton, A., Walsh, K., Wong, S., & Cumming, T. (2015). Using strengths-based approaches in early years practice and research. International Journal of Early Childhood, 47(1), 27–52. https://doi.org/10.1007/s13158-014-0115-8
George Mason University College of Education and Human Development. (2024). Tenure and promotion guidelines: Criteria for tenure. https://cehd.gmu.edu/faculty-and-staff/facstaff/fac-staff-docs/criteria-for-tenure
Green, N., Wolodko, B., Stewart, C., Edwards, H., Brooks, M., & Littledyke, R. (2013). Collaborative self-study of online teaching in early childhood teacher education. International Journal for Academic Development, 18(2), 166–177. https://doi.org/10.1080/1360144X.2012.677747
Gupta, S. S. (2021). Mapping the design and facilitation of critical self-reflection in a culminating clinical course for early childhood special education teacher candidates. The New Educator, 18(1–2), 42–60. https://doi.org/10.1080/1547688X.2021.2005855
Gupta, S. S. (2026, October 21). Mapping toward my next culture. Mapping from the Margins. Ecological Learning Partners. https://ecologicallearningpartners.com/blog/mappingtowardmynextculture
Gupta, S. S., & Lewin-Smith, J. (2020). Employing design-thinking to create opportunities for ECSE teacher candidate reflection through infographic design in an online course. Distance Learning, 17(2), 11–23. https://doi.org/10.1108/DL-12-2020-0002
Hagstrom, G. (2026). DATA 608: Knowledge and visual analytics [Graduate course]. School of Professional Studies, City University of New York.
Han, S., Blank, J., & Berson, I. R. (2020). Revisiting reflective practice in an era of teacher education reform: A self-study of an early childhood teacher education program. Journal of Early Childhood Teacher Education, 41(2), 162–182. https://doi.org/10.1080/10901027.2019.1632993
Knaflic, C. N. (2015). Storytelling with data: A data visualization guide for business professionals. Wiley. https://www.oreilly.com/library/view/storytelling-with-data/9781119002253/
Loughran, J. (2007). Researching teacher education practices: Responding to the challenges, demands, and expectations of self-study. Journal of Teacher Education, 58(1), 12–20. https://doi.org/10.1177/0022487106296217
Meyers, D. C., Durlak, J. A., & Wandersman, A. (2012). The quality implementation framework: A synthesis of critical steps in the implementation process. American Journal of Community Psychology, 50(3–4), 462–480. https://doi.org/10.1007/s10464-012-9522-x
Purcell, M. L., & Schmitt, S. A. (2023). Strengthening preservice educator reflective practice through the use of personnel preparation standards. Journal of Early Childhood Teacher Education, 44(2), 167–183. https://doi.org/10.1080/10901027.2023.2165984
Rodgers, C. (2002). Defining reflection: Another look at John Dewey and reflective thinking. Teachers College Record, 104(4), 842–866. https://doi.org/10.1111/1467-9620.00181
Tufte, E. R. (2001). The visual display of quantitative information (2nd ed.). Graphics Press. https://www.edwardtufte.com/book/the-visual-display-of-quantitative-information/
Vanassche, E., & Kelchtermans, G. (2015). The state of the art in Self-Study of Teacher Education Practices: A systematic literature review. Journal of Curriculum Studies, 47(4), 508–528. https://doi.org/10.1080/00220272.2014.995712
Vélez-Agosto, N. M., Soto-Crespo, J. G., Vizcarrondo-Oppenheimer, M., Vega-Molina, S., & García Coll, C. (2017). Bronfenbrenner's bioecological theory revision: Moving culture from the macro into the micro. Perspectives on Psychological Science, 12(5), 900–910. https://doi.org/10.1177/1745691617704397
Wilke, C. O. (2019). Fundamentals of data visualization: A primer on making informative and compelling figures. O'Reilly Media. https://clauswilke.com/dataviz/
Sarika S. Gupta, Ph.D., is the founder of Ecological Learning Partners LLC.